Chicken or egg

The euro area in the autumn of 2026 is not in crisis. It is something duller. Its central bank expects output to grow by 0.9% this year and 1.4% next, unemployment to fall from 6.2% this year to 5.9% by 2028, and inflation to average 3.0% in 2026, peaking at 3.6% at the end of the year after a surge in energy prices from the conflict in the Middle East.
Exports are held back by a stronger euro and American tariffs. Spending on defence and infrastructure adds about half a percentage point of growth spread over four years, most of it in Germany, and the end of the European recovery fund in Italy, with budget savings assumed in France, accounts for most of a temporary slowdown in government consumption growth in 2027.
Jobs are holding. Growth is thin. Prices are rising again. Between mid-2021 and the peak of inflation, real wages fell by about 5%, and the wage share dropped to just above 61% at the end of 2022, while the environment turned out more favourable to profit margins.
In September 2022 the poorest fifth of households faced inflation 1.9 percentage points higher than the richest fifth, mainly through energy and food. In 2023 23.2% of people below the poverty line could not keep their home warm, against 9.0% of everyone else.
Why growth stays thin is where two readings of the same economy part.
Productivity first
The first reading starts from supply. Around 70% of the gap in income per head between the EU and the United States is explained by lower productivity; the single market is fragmented, firms cannot scale, and the investment share would have to rise by around five percentage points of GDP.
Productivity is the engine and output follows it. Across eight euro area countries, limited access to finance cost an estimated 21% of labour productivity in Italy and Portugal. The prescription follows: integrate the markets, move savings into them, invest, and keep public debt on a path that the fiscal rules can sign off.
On this reading, wage growth follows productivity. If wages rise faster than productivity, unit labour costs rise and competitiveness can suffer.
Demand first
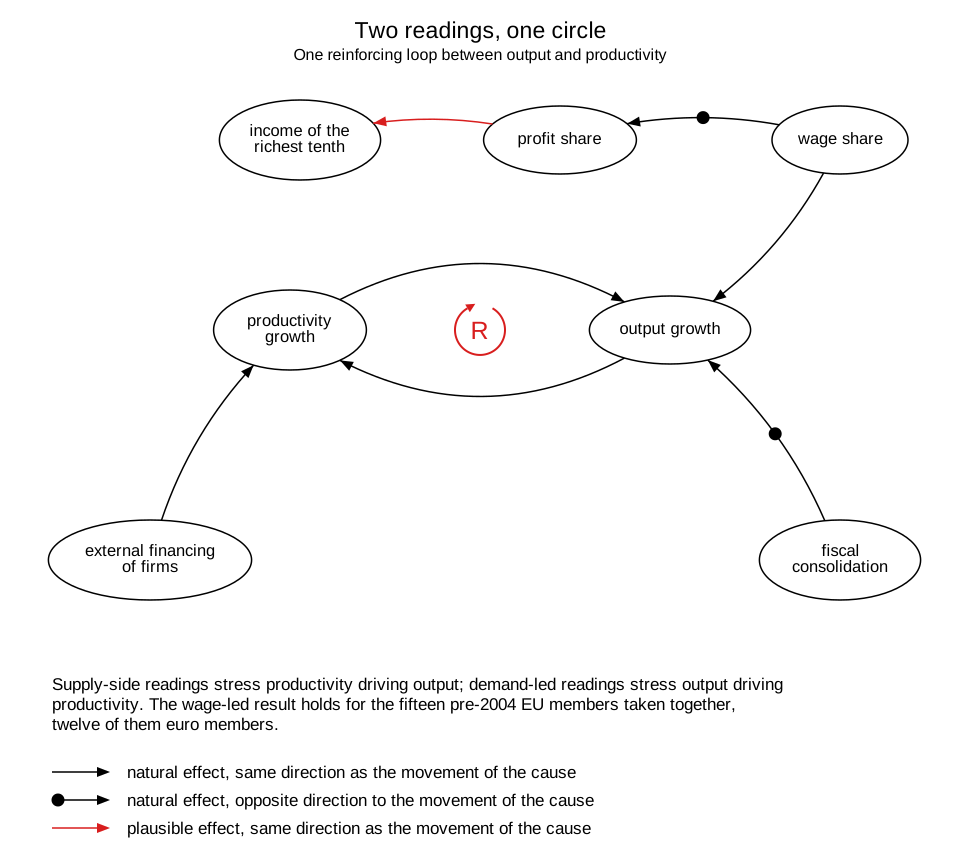
The second reading starts from spending. Across the fifteen members the EU had before 2004, twelve of which use the euro, a fall in the share of income going to wages lowers growth in eleven of the fifteen countries taken separately, and a coordinated fall of one percentage point across all of them lowers their combined output by 0.3%. Each country squeezing the wage share to win exports from its neighbours leaves thirteen of the fifteen with lower output.
And the engine runs the other way. In major European economies between 1980 and 2015, growth in demand helped determine productivity, above all in manufacturing. Across ten euro area economies from 1995 to 2020, exports and productivity fed each other in circles that, for most of the countries examined, widened the gaps in labour productivity, with wages working both ways: lower wages improve price competitiveness, and weaker demand slows the productivity it relies on.
On this reading the euro area’s current account surplus is the other side of weak demand at home, income neither spent nor invested there, and consolidation in a downturn shrinks the economy it is meant to repair.
Round in circles
Put side by side, the two readings disagree mainly about where a circle starts. The first says productivity drives output; the second says output drives productivity. Both have support in the evidence, from different methods and periods, and taken together they make a circle that neither reading draws alone: faster growth raises productivity, and higher productivity raises growth. It runs upwards and it runs downwards, and years of thin growth are the downward version.
What each reading does with the circle is a choice about who goes first. The supply reading pushes on productivity: better financing, deeper markets, reforms, and patience from wage earners while the investment arrives. The demand reading pushes on output: higher wages, public spending, and patience from creditors while the debt ratio waits for the denominator. Each push is evidenced. Which one starts the circle is difficult to settle from the circle itself. Policy still has to choose where to push first.
Please hold
Each reading asks someone to carry the cost until the circle turns. The supply reading asks it of wage earners, who are to moderate their pay, of households, who are to move their deposits into markets where half of the capital invested through European funds goes to the United States, and of the users of public services, who absorb the consolidation. The demand reading asks it of profits, which would cede share to wages, and of holders of public debt, who would wait longer for the ratio to fall.
The euro area’s fiscal rules and its savings union follow the supply reading’s prescription. Whether growth comes from productivity or from wages is, in the end, a question of who waits for it.