Claims on the recovery
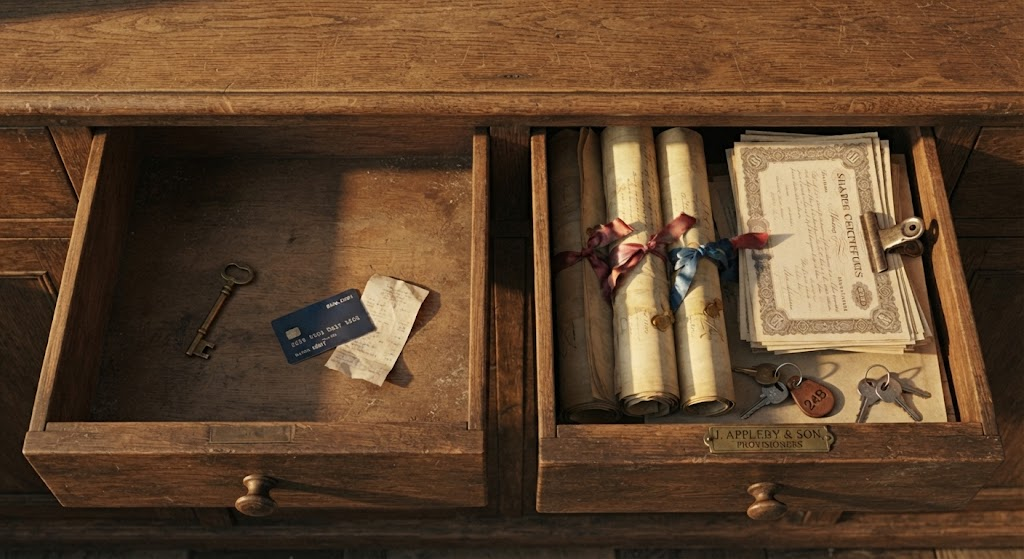
At the end of 2025 the average household in the poorer half of the euro area held €45,800 in housing, €18,400 in deposits, €500 in listed shares, €800 in unlisted shares and other equity and €1,200 in fund shares. It owed €7,500 on loans other than a mortgage. The average household in the richest tenth held €1.22 million in housing, €256,300 in deposits, €89,900 in listed shares, €384,900 in unlisted shares and other equity and €200,500 in fund shares.
A rate cut, a rally on the stock market or a rise in house prices reaches a household through what is on its list. The two lists share a house and a deposit account; the rest of the second list barely appears on the first.
Mostly bricks
Measured as shares of what each group owns, the poorer half holds 63% of its assets in housing, 25% in deposits and 4% in business wealth. The next four tenths are the most tied to the house, with 71% in housing and 15% in deposits. The richest tenth holds 46% in housing, 24% in business wealth, 11% in listed shares and fund shares, and 10% in deposits.
Debt sits at the other end. What the poorer half owes comes to 38.5% of what it owns, against 5.3% for the richest tenth, and loans other than mortgages match a tenth of the poorer half’s assets. In 2023 36.5% of households in the poorest fifth by wealth had debt other than a mortgage, against 18.5% in the richest tenth.
Owning the shop
The concentration is sharpest where the claim is on a firm’s future profits. In the ECB’s accounts the richest tenth holds 91% of unlisted shares and other equity and 78% of non-financial business wealth, and the ECB describes business wealth as showing similarly high concentration. The shares households hold, directly and through funds, are held mostly by the same tenth, and half of them were issued outside the EU.
Income follows the same lists. In a 2018 ECB working paper on households by income fifth, wages and salaries made up about 20% of gross income in the bottom fifth and 60% in the top. Income from financial assets and rent rose from 2% to almost 10%, and transfers and unemployment benefits fell from almost 20% to about 3%. In those figures, a recovery that raised income from assets reached the top fifth through almost a tenth of its income and the bottom fifth through a fiftieth.
Three roads from Frankfurt
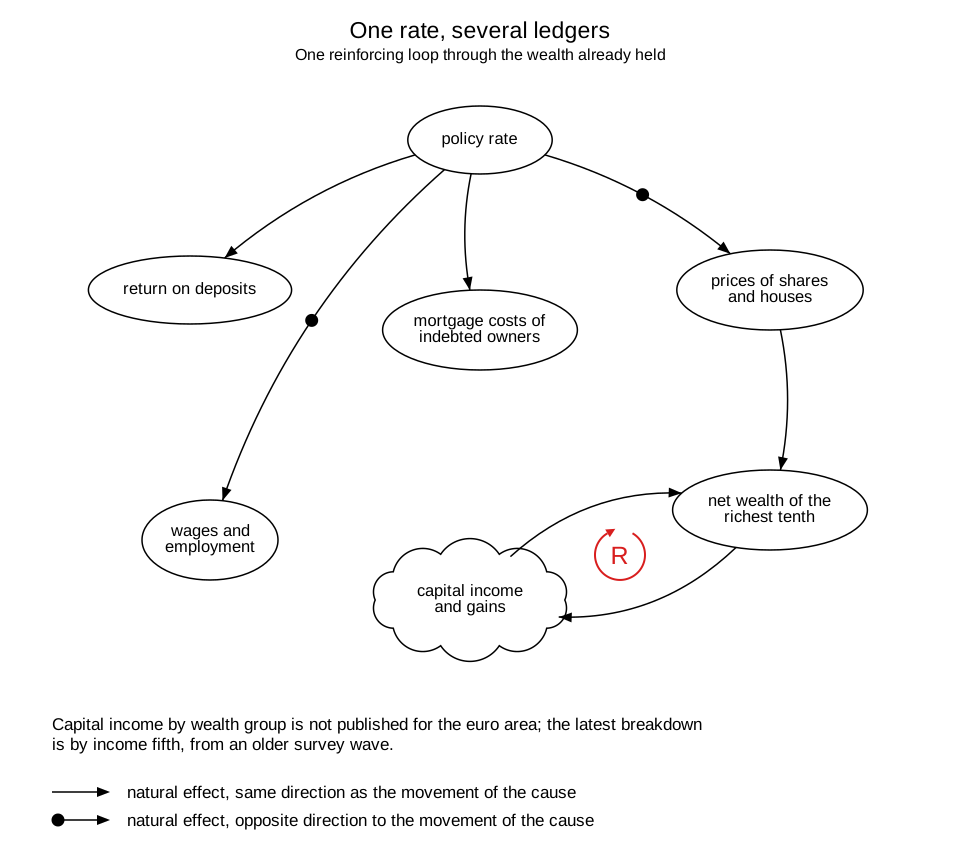
An ECB article lists three main routes by which a change in interest rates reaches households: what savings earn and debts cost, which follow the size and composition of balance sheets, asset prices, which follow what is in the portfolio, and jobs, which weigh most in the bottom fifth. The ECB’s chief economist described a cut on each list: homeowners with limited financial assets tend to have a mortgage whose cost falls, while those with substantial financial assets often earn less on them.
When prices rose after 2021, the same lists decided who lost. The composition of assets and liabilities across the wealth distribution set how far inflation moved wealth inequality, and the deposits the poorer half relies on lost about an eighth of their purchasing power in two years.
The missing pension
One large claim is absent from these lists. The ECB’s accounts leave pension entitlements out “owing to constraints in the availability of data”. Its household survey counts private pension plans and life insurance but not public and occupational pension schemes, which are hard to value where they are unfunded.
Where the survey does see pension plans and life insurance, they are more common among the fifth of households with the highest incomes, except in the Netherlands and Slovakia, where nearly every household has one. Among the financial assets the accounts can allocate, life insurance and annuities are held 65% by the richest tenth and 6% by the poorer half.
The short list
For the poorest fifth the list is short. In 2023 3.5% of them owned the home they lived in and 1.8% owned a listed share, against 94.5% and 35.8% in the richest tenth.