The stock remembers

In February 2026 the ECB’s president told the European Parliament that real wages had recovered and on average risen above levels seen in early 2021. The prices they are measured against stayed where inflation had taken them: euro area consumer prices averaged 19.5% higher in 2025 than in 2021, and nothing in the recovery of a wage brings that level down.
A wage is a flow, paid again each month at the new rate. A deposit, a house, a pension claim or a share in a firm is a stock, and a stock carries what happened to it into the years after.
Not quite back
The money that sat in deposits through 2022 and 2023 lost about an eighth of its purchasing power, and no later rise in wages returns it. Across all households, real net wealth began to decline in 2022 and fell back to its pre-pandemic level in the course of 2023, and among the reasons the ECB gives for the high saving rate since then is that households were incentivised to rebuild their real net wealth. In the first quarter of 2026 they still saved 14.3% of their income.
The tortoise loses
Saving is the slow way to build a stock. In the ECB’s account of household wealth, changes in net worth are primarily driven by valuation gains and losses on real estate holdings, while the contribution of net saving stayed relatively stable from 2000 to 2019. At the end of 2025 household net worth was still growing at 4.7% a year, on continued valuation gains in financial and non-financial assets in addition to new net investments.
A valuation gain reaches only the household that already holds the asset. The one saving towards a home adds to its stock at the rate of its income; the one that owns adds at the rate of prices.
Owed from abroad
A decade of surpluses has turned into a stock as well. At the end of 2014 the euro area owed the rest of the world €1.3 trillion more than it was owed, about 13% of its GDP. By the first quarter of 2026 it held net claims of €1.80 trillion, 11.2% of its GDP. In shares the position runs the other way: the same release puts its net liabilities in portfolio equity at €4.37 trillion.
The stock can move more through valuation than through saving. In the second quarter of 2025 exchange rates cut the euro area’s net claims by €498 billion, while transactions in the same quarter added €91 billion.
Capital not built
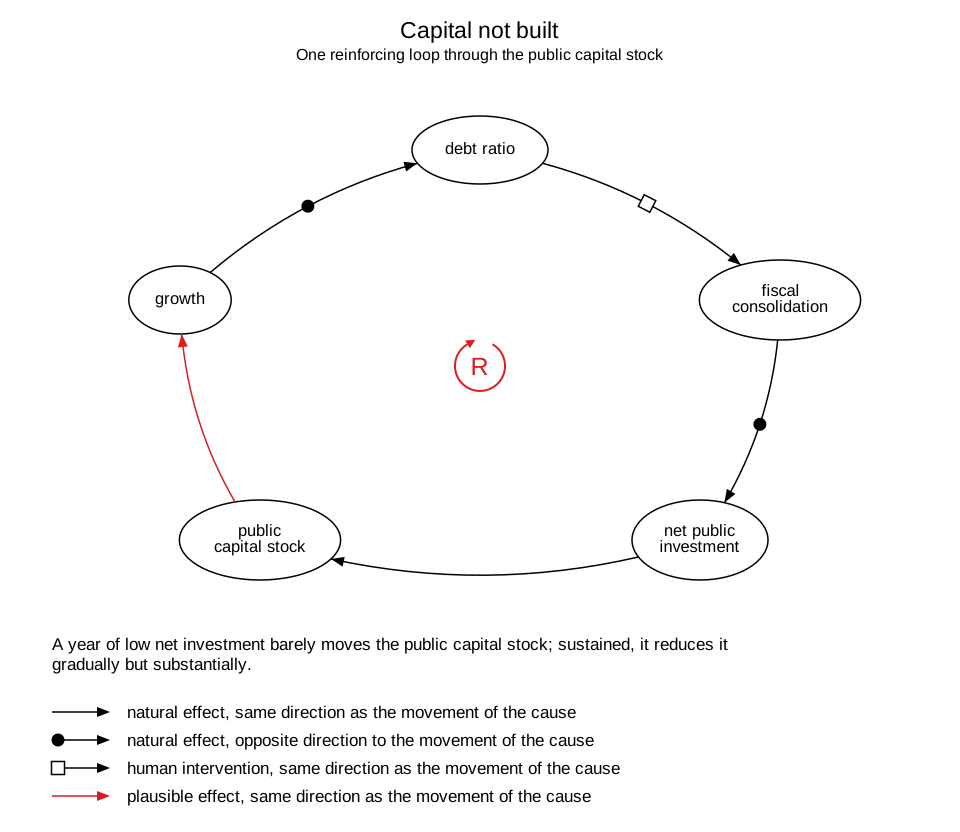
What the state owns is a stock too. After the financial crisis, public investment in the EU could scarcely keep up with depreciation levels, reflected in net investment close to zero on aggregate in the period 2010-2019, and in Greece, Italy, Portugal and Spain, which had to consolidate, it was often very low or negative. In Eurostat’s accounts Italy’s net public investment was below zero every year from 2011 to 2022, and Portugal’s from 2012 to 2022.
Off the books
One of the largest claims on future household income is the one least seen. In most EU countries pension entitlements from social insurance came to between 200% and 400% of GDP in 2021, and in Spain, Italy, Greece, Austria and the Netherlands they were above 400%. Summed from Eurostat’s country figures, they come to almost four times euro area GDP, most of them in unfunded schemes. Who holds how much of them is not measured by wealth group.
A household with little recorded wealth can still hold a large claim on future income through a pension system, and a household with a large recorded balance sheet can depend little on one.
The top of the distribution is hard to see for another reason. An earlier ECB working-paper estimate, made to fill in the households a survey misses, put the richest 1% at 28% of euro area net wealth in 2020, with net wealth up by almost 50% since 2009 against 28% for everyone else. The ECB’s distributional wealth accounts publish no top 1% series.
Eurostat collects the pension figures once every three years. The latest full round is for 2021.