Lent against bricks

The average Irish home cost €349,838 in 2007 and €205,476 in 2012, a fall of about two fifths in five years. By June 2023 the national price index stood 2.1% above its April 2007 peak. In Spain the climb back stayed shorter: at the end of 2023 nominal prices were still 2% below their 2007 peak, and real prices 28.5% below.
By December 2013 37% of Spanish bank credit for construction and real estate development had gone bad, even after the banks’ transfers of assets to Sareb had lowered the ratio. In Ireland the bust ended up on the state’s balance sheet, which is where the spiral between states and banks began.
Under cheap money, share prices rose and faded while house prices kept rising for years. Property in the euro area is not only something people live in. It is what they borrow against, and what banks lend against.
By its own bootstraps
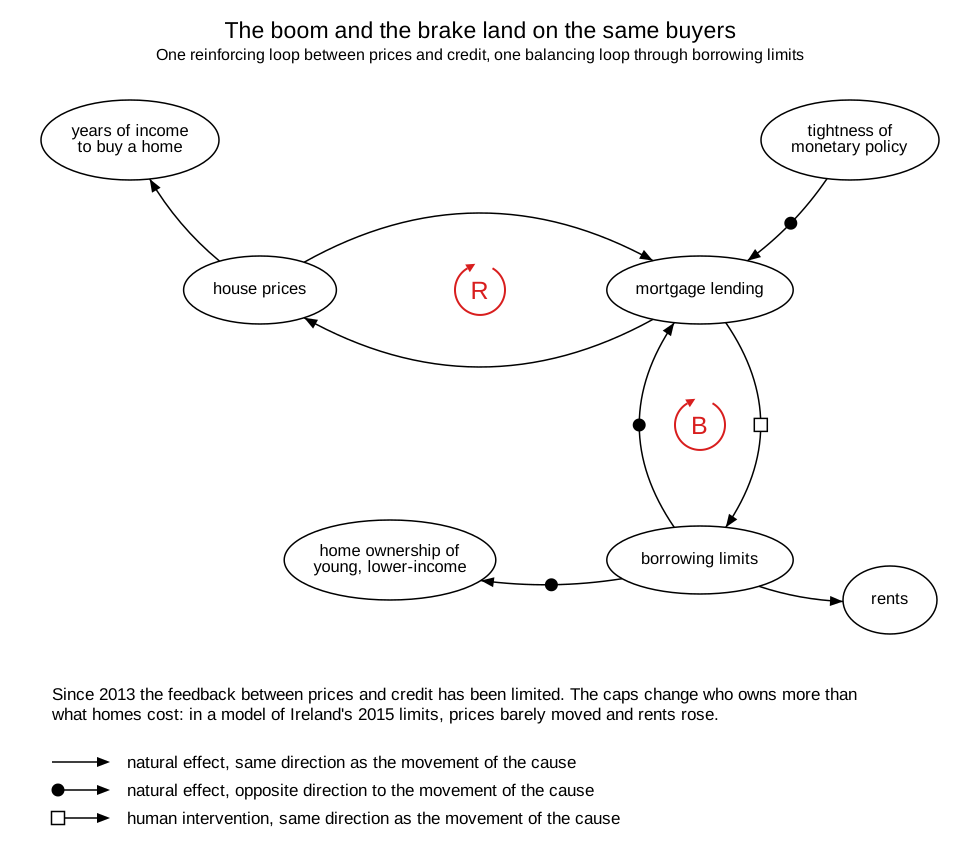
A home is collateral. When its price rises, a home can support a larger loan at the same loan-to-value ratio; when more credit is available, buyers can bid more for the next home.
Across nine EU countries credit shocks have a sizeable effect on house price growth, while house price shocks move mortgage credit faster, for longer, and explain more of its variation. Before the bust, Spain showed the same pattern in a single market: loans for house purchase depend positively on house prices, and the two push each other up at the same time.
The circle contains no automatic brake. It runs upwards as long as buyers and lenders expect prices to keep rising, and it runs downwards the same way: falling prices shrink what can be lent, smaller loans lower what buyers can pay. Ireland and Spain went up it in the 2000s and down it after 2008.
The recovery after 2013 ran differently: house prices rose before credit did, on the back of returning income growth and low interest rates, and the feedback between the two appears to have been limited. The circle is a description of the boom, not of every decade.
The brake
The check, when it comes, is a decision. Many euro area countries now limit how much can be borrowed against a home, through caps on loan-to-value or debt-service-to-income ratios or on maturities.
Across fifteen euro area countries from 2009 to 2023, banks tightened their credit standards when such limits came in, and tightened them more where mortgage lending or property prices were growing fast, which is the brake doing what it is for: smoothing the credit cycle. There is mild evidence that legally binding limits tightened banks’ lending standards more than recommendations did.
What the brake changes, though, is mainly who borrows, not what homes cost. In a model of limits like those Ireland introduced in 2015, house prices barely moved, by −0.01%, while rents ended up 3% higher and the home ownership rate fell by around 2 percentage points. Locally, prices did fall in the postcodes where more borrowers stood above the income threshold, and poorer borrowers bought cheaper homes.
The circle between prices and credit turns within a single housing market over a few years, and so does the brake. Monetary policy pushes on lending from outside: negative rates came with steadily faster growth in bank lending, and the rate rises of 2022 and 2023 leaned the other way. Prices stood below their level a year earlier from mid-2023 to early 2024 and climbed again after: in the year to the second quarter of 2026 euro area house prices rose by 4.0%.
Closed from both sides
On the way up, the boom prices newcomers out. Between 2010 and 2024 house prices in the EU rose by 53%, consumer prices by 39%. In Spain a home cost 7.3 years of income at the end of 2023, the share of renters overburdened by housing costs is above the EU average, and 65.9% of 18 to 34 year olds still lived with their parents in 2022, against roughly half across the EU.
Across the euro area in 2025, 29.3% of people below the poverty line spent more than 40% of their disposable income on housing, against 3.6% of everyone else. Among tenants paying market rent the share was 18.0%, among owners with a mortgage 4.5%.
The brake does not open the door again. It closes it from the other side. In Ireland, income-based limits mostly constrain younger, lower-income borrowers. In the model of Ireland’s limits, the households kept out of a mortgage stayed renting for longer, pushing rents up; young, lower- and middle-income households bore the largest losses, current homeowners were largely unaffected, and owners of rental property gained.
In simulations across Ireland, Italy, the Netherlands and Portugal, borrowing limits raise wealth inequality moderately, because the households they keep out of a mortgage are kept out of the asset that builds wealth. Their effect on income inequality is negligible.
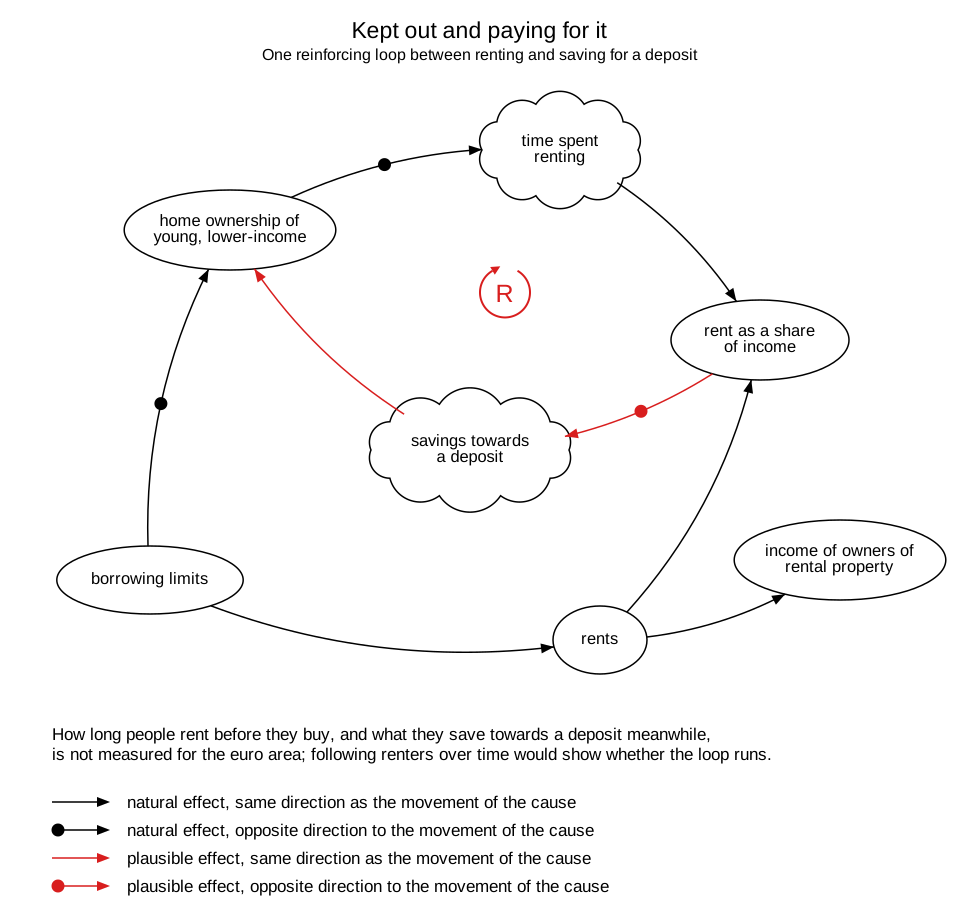
Those who already own ride the boom, and the brake leaves their position where it was. The caps exist to keep the next boom from filling banks’ mortgage books the way Ireland’s were filled; they do not reach the loans already made. Owners of rental property collect the rents of those turned away.
The adjustment, boom or brake, runs through the people trying to come in. When prices climb, they pay in years of income; when the caps tighten, they pay in the home they do not get to buy. Neither tool was designed against them. Both settle on them, because they have no stake yet in keeping prices where they are.