Handle with care
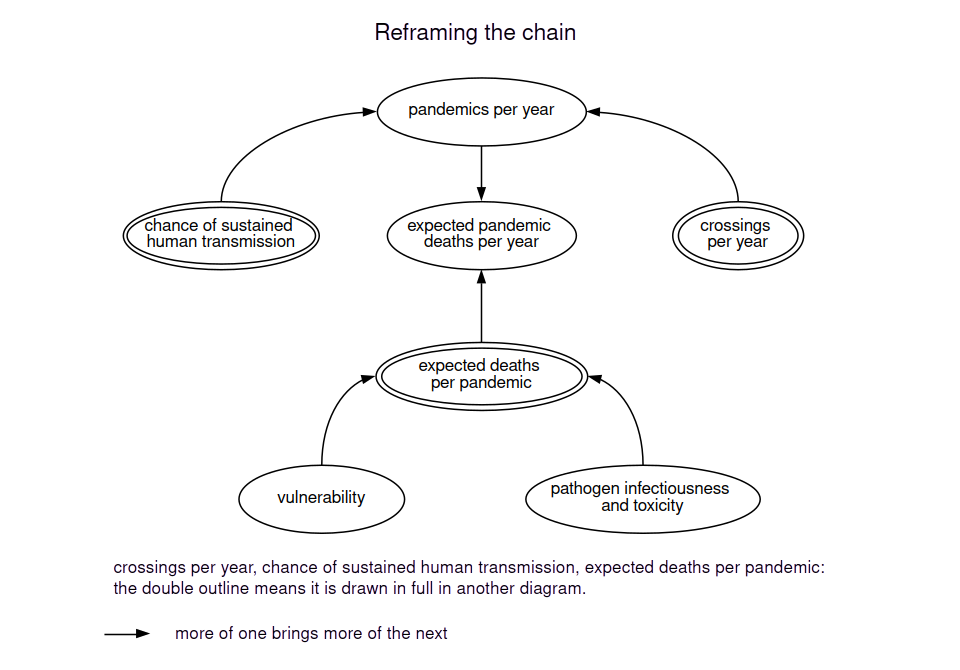
In the reframed chain, vulnerability is one of two factors in the expected deaths per pandemic. The term groups what the UN’s terminology calls exposure, vulnerability and capacity. Liberation’s summary of Lescure’s book describes the same vulnerability: stressed bodies, suffocated public hospitals and minds saturated by “antisocial networks”.
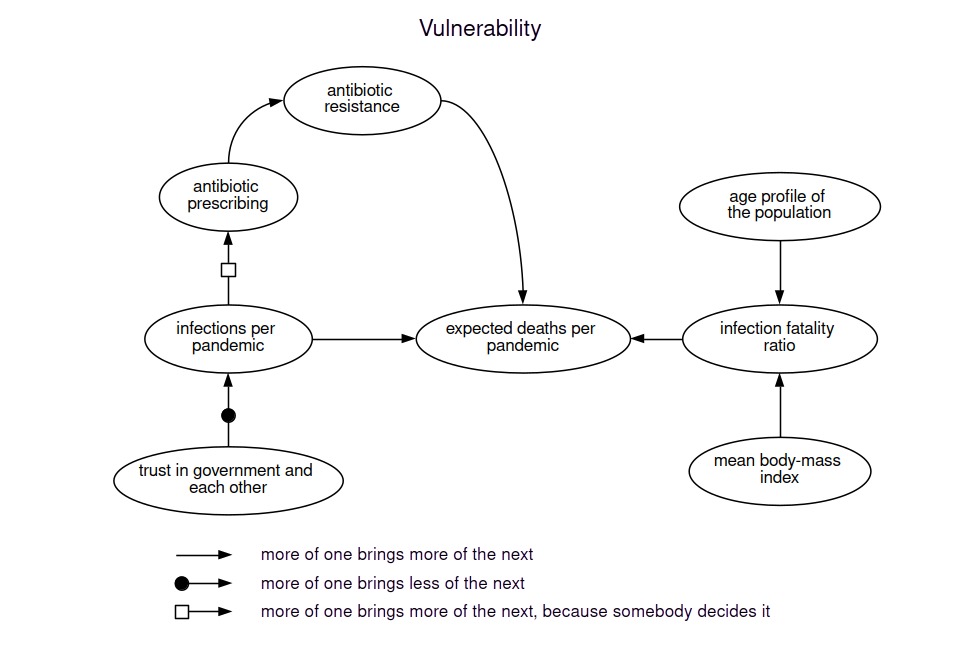
Bollyky and colleagues estimated the share of infected people who died of covid, the infection-fatality ratio (IFR), in 177 countries and territories, from January 2020 to September 2021, and asked what explained the differences between them. The age profile of the population explained 46.7% of the differences (uncertainty interval 18 to 68). Gross domestic product per head explained 3.1%, and mean body-mass index 1.1%. Another 44.4% “could not be explained”. The authors call their study “an ecological analysis” that “was not designed to provide information about the causes of COVID-19 variation”.
Stressed bodies
Clark and colleagues estimated in 2020 that “1.7 billion (UI 1.0-2.4) people, comprising 22% (UI 15-28) of the global population, have at least one underlying condition that puts them at increased risk of severe COVID-19 if infected”. That share runs from under 5% of people younger than 20 to over 66% of those aged 70 or older. About 349 million people (186 to 787 million), 4% (3 to 9) of the world, “would require hospital admission if infected”.
In Bollyky’s study, “A 10% increase in BMI was associated with an increase in age-standardised IFR of 17.4%.”
Prepared on paper
Bollyky’s group tested seven measures of health-care capacity, among them the coverage index of universal health coverage, the Healthcare Access and Quality Index, hospital beds per head and health spending per head. They “were not favourably associated with standardised infection rates or IFRs”. Nor were the pandemic-preparedness indices, among them the Global Health Security Index and the WHO’s Joint External Evaluation.
None of these measures counts a ward full during a surge. Bollyky’s group read the result as the indices failing “to account for the consequences of poor leadership and dysfunctional political environments”.
Full wards
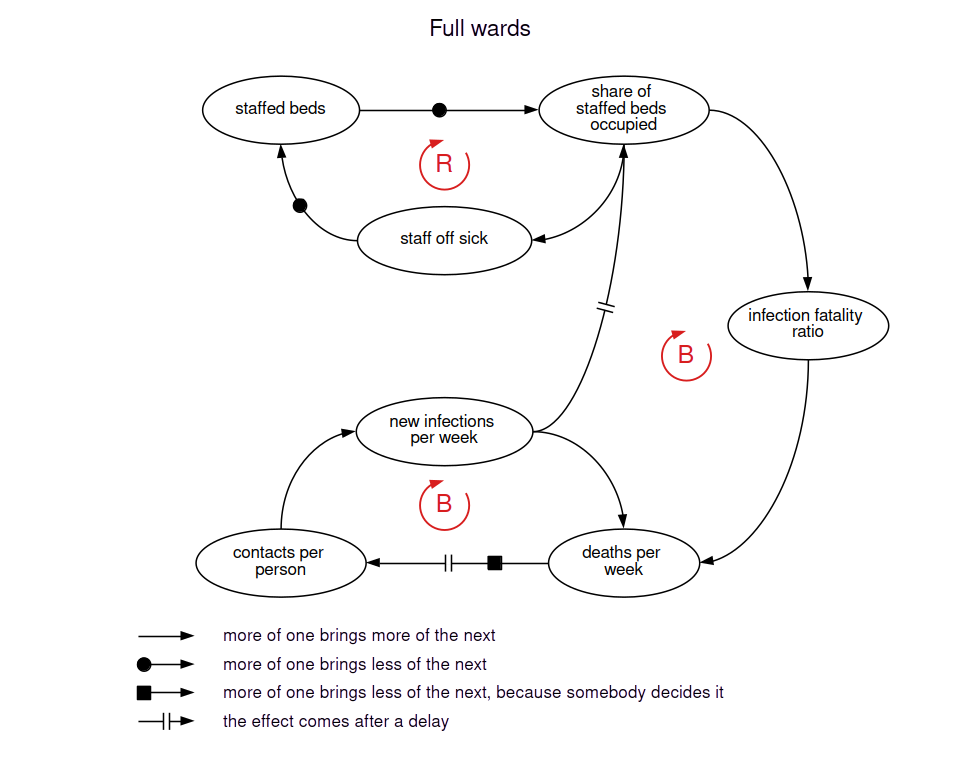
The sickest of the infected fill staffed beds, after the delay between catching the virus and needing one. Nurses and doctors catch it too, or stop working from exhaustion, and a bed with no one to staff it closes, which leaves the remaining beds fuller and sends more staff home.
A fuller ward raises the share of infected people who die: patients wait longer, and each nurse looks after more of them. More deaths per week make people cut their contacts, after a delay, and fewer contacts mean fewer new infections. Only two of these links are measured: more infections, and a higher fatality ratio, mean more deaths per week. The rest are intuitive jumps. No study in this series sets staff absence or deaths against ward occupancy, or contacts against deaths.
A count of beds per head made before the pandemic does not include staff falling sick.
As trusting as Denmark
Bollyky’s group found that “measures of trust in the government and interpersonal trust, as well as less government corruption, had larger, statistically significant associations with lower standardised infection rates.” Higher trust was also associated with higher vaccine coverage in middle-income and high-income countries, and lower corruption with larger falls in mobility. “If these modelled associations were to be causal”, trust at Denmark’s level everywhere “might have reduced global infections by 12.9% (5.7-17.8) for government trust and 40.3% (24.3-51.4) for interpersonal trust”.
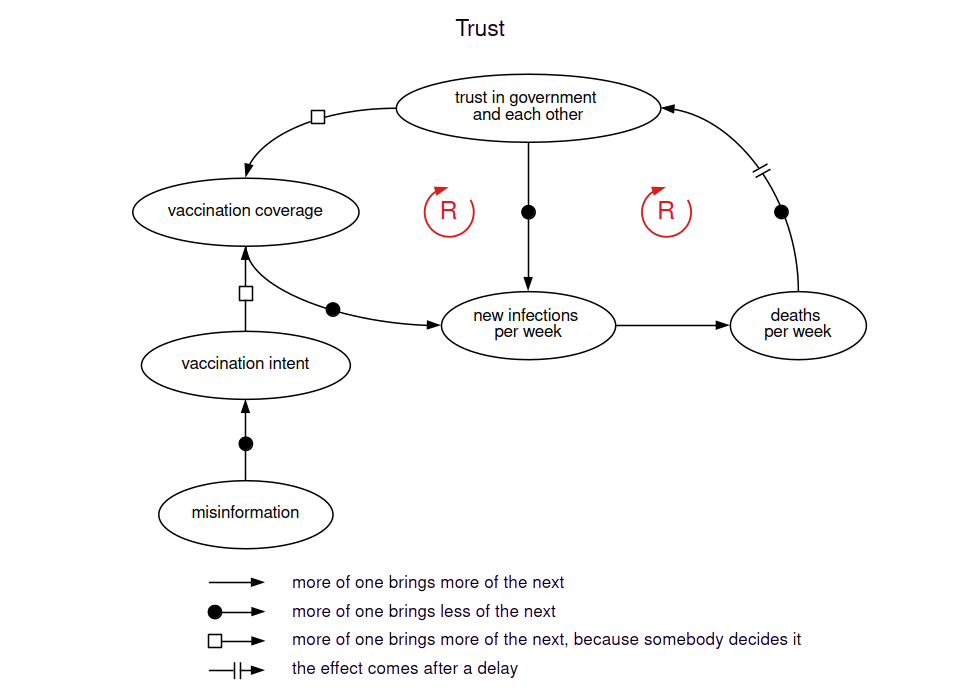
Deaths, after a delay, lower trust in the government that was meant to prevent them, an intuitive jump, since Bollyky’s associations run from trust to infections and no study here follows trust after deaths rise. That vaccinations lower infections is a second jump, which no study in this series measures.
Saturated minds
Loomba and colleagues ran a randomised trial with 8,001 people in the UK and the US in September 2020. In the UK 3,000, and in the US 3,001, were shown recent misinformation about covid vaccines, and 1,000 in each country were shown factual information. Among those who had said they would definitely take a vaccine, the misinformation, relative to the factual information, “induced a decline in intent of 6.2 percentage points (95th percentile interval 3.9 to 8.5) in the UK and 6.4 percentage points (95th percentile interval 4.0 to 8.8) in the USA”. “Scientific-sounding misinformation is more strongly associated with declines in vaccination intent.” The trial measured what people said they would do, not whether they were vaccinated. The step from intent to vaccination is an intuitive jump.
Pneumonia after influenza
Morens, Taubenberger and Fauci examined lung tissue from 58 people who died in the 1918 influenza pandemic and reviewed 109 published autopsy series. The evidence “clearly and consistently implicated secondary bacterial pneumonia caused by common upper respiratory-tract bacteria in most influenza fatalities”. There were no antibiotics to treat it.
In 2009, MacIntyre and colleagues found secondary bacterial infections in “almost 1 in 4 severe or fatal cases” in the studies that tested for them, most often Streptococcus pneumoniae. Antibiotics now treat that pneumonia, as long as the antibiotics still kill the bacteria.
Across 154 studies of covid patients up to June 2020, Langford and colleagues estimated “the prevalence of antibiotic prescribing was 74.6%”; pooled from the 31 studies that reported it, bacterial co-infection was 8.6%.
Bell and colleagues found “a positive relationship between antibiotic consumption and resistance” across 243 studies, with a pooled odds ratio of 2.3 across the 88 that allowed one. Goossens and colleagues compared 26 European countries between 1997 and 2002. France used 32.2 defined daily doses per 1,000 inhabitants per day, the Netherlands 10.0, and resistance was higher where use was higher. For penicillin and Streptococcus pneumoniae, the bacterium MacIntyre found most often, the Spearman correlation across 19 countries was 0.84.
Barnes and MacIntyre estimate that in 2009 resistant pneumococcal pneumonia “contributed to 1.8% to 2.3% of deaths”, a minimum, since only laboratory-confirmed cases count. If resistance everywhere reached the highest regional levels, around 90%, they project “a three- to four-fold rise in mortality due to secondary pneumococcal infections in future influenza pandemics”.
Age will not budge
Age explained the largest share of the differences, and it cannot change during a pandemic. Body-mass index changes over years. Trust and staffed beds can change within a pandemic. Each can feed on itself, so a fall brings a further fall, and a rise a further rise. Antibiotic prescribing may also raise deaths in the next pandemic, an intuitive jump: the resistant bacteria it selects can still be there when the next one comes.