The short way round
Brockmann and Helbing take Mexico as the source of the 2009 H1N1 pandemic’s spread, with the initial outbreak on 17 March. They took the date of the first confirmed case in each of 140 countries, which is when the virus was reported there, not necessarily when it arrived, and set it against that country’s distance from Mexico. Distance from Mexico explained about 4% of the variation in reported first-case dates (R² = 0.0394). For SARS in 2003, across 29 countries, arrival also “correlates weakly with geographic distance”.
A pandemic is defined by how far it spreads, not by how severe the illness is, so the chain counts one only once it has spread. The arrival-time analyses start from an outbreak already spreading and estimate where and when it arrives, not whether it takes hold there.
Distance by passenger share
Brockmann and Helbing replaced kilometres with a distance built from air traffic. Their network, built from airline data supplied by OAG, has 4,069 airports, 25,453 direct connections and about 8.91 million passengers a day. For each route they take the share of the travellers leaving one airport who fly to another, and turn it into a length with a logarithm: d = 1 − log P. A small fraction of traffic on a route “is effectively equivalent to a large distance, and vice versa.” The logarithm lets lengths add up along a path, where the probabilities multiply.
P is a share of the traffic leaving an airport, not a number of passengers. Halving traffic on every route out of an airport leaves every share, and so every effective distance, where it was.
The distance is not the same in both directions. A disease seeded at an airport on the edge of the network “has a higher probability of being transmitted to a well-connected hub than vice versa”, much as a network of one-way streets can make the trip from A to B shorter than the trip back.
Arrival in order
In their simulation of an outbreak starting in Hong Kong, geographic distance explained 34% of the variation in arrival times (R² = 0.34), and effective distance 97% (R² = 0.973). Measured in effective distance, the simulated outbreak spreads as a wave at constant speed. On a coarser network of 189 countries and 5,004 links, the H1N1 and SARS arrival dates show the same linear relation with effective distance. Errors in the reported dates, the authors note, “can add noise to the system, which increases the scatter”.
Arrival time works out as effective distance divided by an effective speed. “The epidemiological parameters determine the effective speed, whereas effective distance depends only on the topological features of the static underlying network.”
Early in an outbreak, when the pathogen’s parameters are still unknown, the order can already be estimated, provided the mobility network remains stable. The model leaves out the response and mitigation measures that can change the course of an outbreak.
Sprouts from Uelzen
The arrival test starts from a known source. Run backwards, the same geometry can point to an unknown one. Measured in effective distance, a modelled outbreak spreads in roughly circular wavefronts around its true origin. The method ranks each candidate origin by how circular the observed spread looks from there. For H1N1, the method picks Mexico from the case counts in every week tested except the last, week 29, when it picks the United States.
The second test was in Germany. In 2011 an outbreak of enterohaemorrhagic E. coli caused about 4,000 cases and 53 deaths, and the reported cases were scattered across the country. Here the network was not air traffic but food distribution between Germany’s 412 districts, which they estimated with a gravity model. The method pointed to Uelzen district. A local farm in Bienenbuttel, in that district, “was later identified as the source of contaminated sprouts”. Several other districts scored almost as well, so the method narrowed the possible origins without reliably picking one.
A few large cities
In 2004 Hufnagel, Brockmann and Geisel modelled SARS spreading through the world’s airline network.
Air traffic is uneven. In Brockmann’s words, “the dynamics is dominated by only a small percentage of transport connections”; in Hufnagel’s, “the high degree of predictability is caused by the strong heterogeneity of the network”.
They placed one infected person in a city and let them travel. Their model estimated that, on average, 74.58% of the population would need vaccination to stop the epidemic if that person made two trips. Isolating only 2% of the largest cities brought that share down to 37.50%. Shutting down the busiest routes worked much less well: the top 27.5% of connections had to be removed for a similar reduction in the vaccination share. Hufnagel’s own conclusion is that “a quick and focused reaction is essential”.
After the seeding
The Wuhan travel ban began on 23 January 2020. By then, Chinazzi and colleagues found, “most Chinese cities had already received many infected travelers”. In their model the ban “delayed the overall epidemic progression by only 3 to 5 days in mainland China but had a more marked effect on the international scale, where case importations were reduced by nearly 80% until mid-February”. Cutting travel to and from mainland China by 90% would “only modestly affect the epidemic trajectory unless combined with a 50% or higher reduction of transmission in the community”.
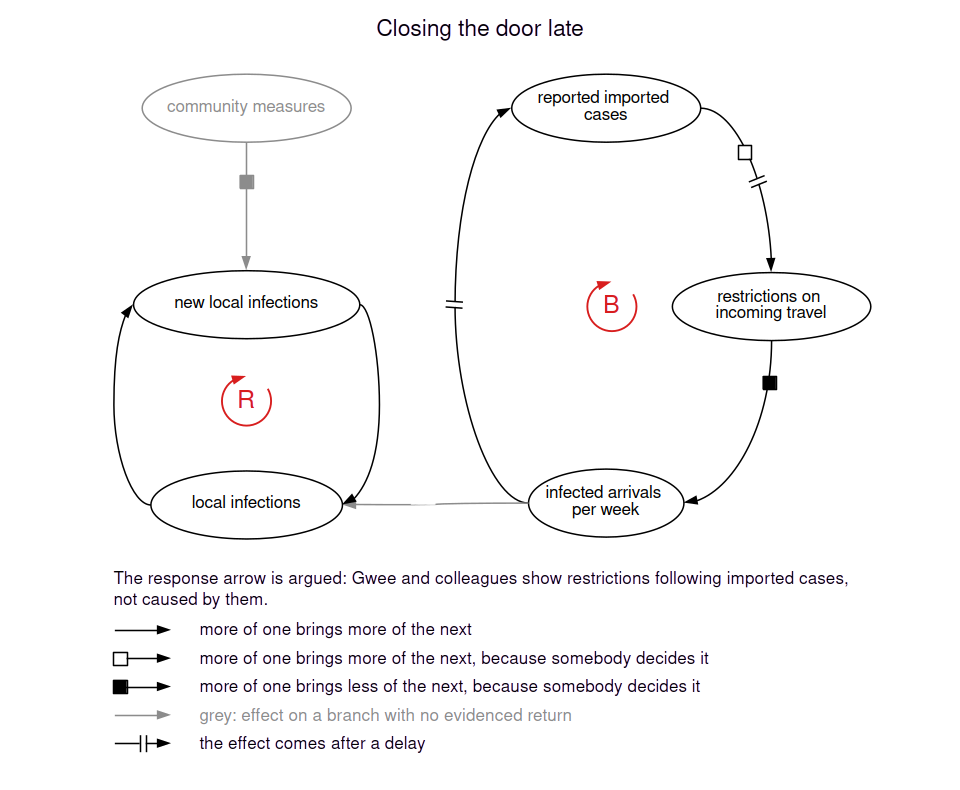
An infected traveller is reported only some time after arriving, and the decision to restrict comes some time after the report. Travellers who arrive in between can seed local transmission.
Local transmission grows while each infected person passes the virus to more than one other on average, given the immunity and measures already in place. That number is the effective reproduction number, and R0 is the same number in a completely susceptible population. A restriction cuts only the arrivals. In Chinazzi’s model, once a virus spreads locally, fewer arrivals change little unless transmission in the community is also reduced.
Gwee and colleagues compared Singapore, Taiwan, Hong Kong and South Korea. “Singapore, Taiwan and Hong Kong respectively recorded imported cases from Europe two weeks before any restriction targeted the region.” The cases came before the restrictions, but governments were also responding to the outbreaks in Europe. Their conclusion: “Travel restriction was effective in preventing COVID-19 case importation in early outbreak phase, but may still be limited in preventing general local transmission.”