Reframing the chain
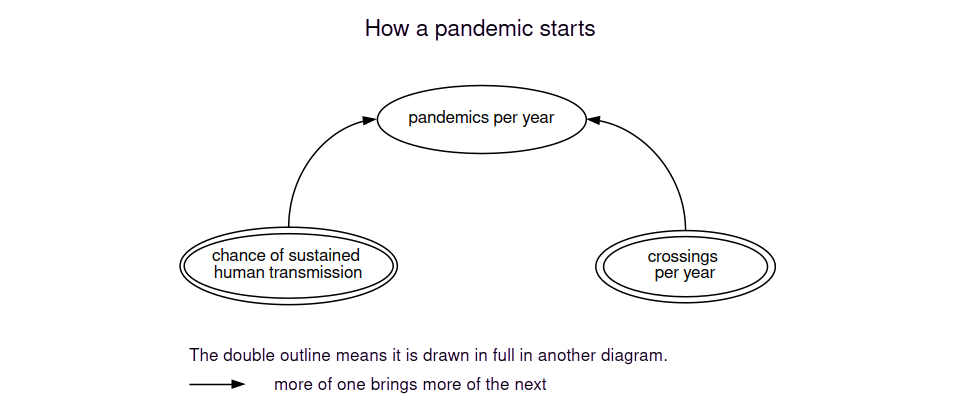
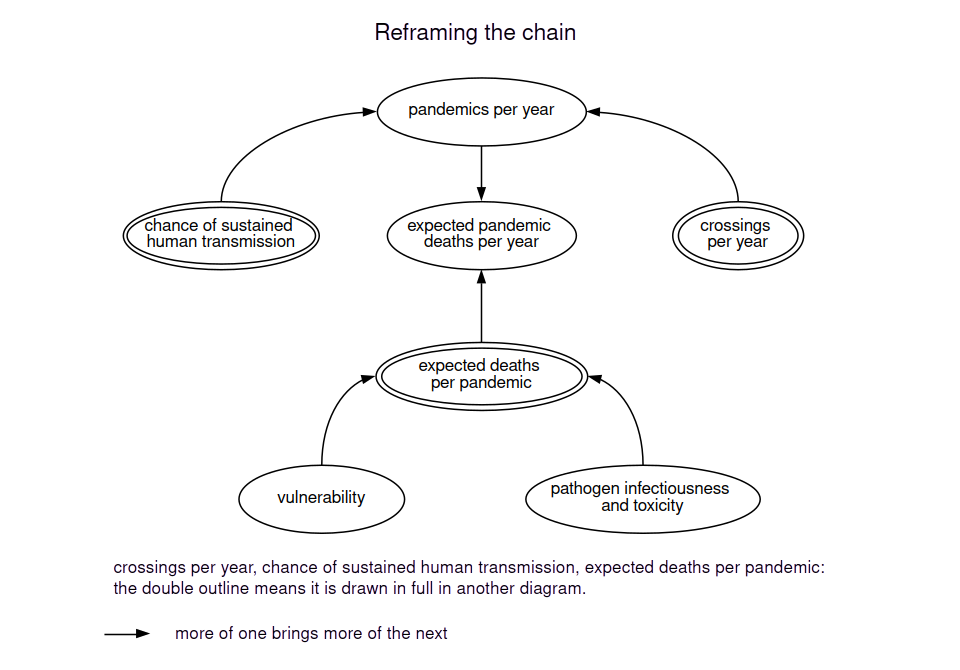
Counting pandemics gives the same weight to one that kills thousands and one that kills millions. The original chain counts them that way: crossings and sustained human transmission set how many pandemics start per year.
Counting the dead
expected pandemic deaths per year = pandemics per year x expected deaths per pandemic
expected deaths per pandemic = pathogen infectiousness and toxicity x vulnerability
Lescure’s three terms are back, emergence as crossings, propagation as sustained human transmission and fragility as vulnerability, with the pathogen’s infectiousness and toxicity as a fourth.
The UN’s disaster terminology defines disaster risk as “the potential loss of life, injury, or destroyed or damaged assets … determined probabilistically as a function of hazard, exposure, vulnerability and capacity”. Biological hazards are also defined “by their infectiousness or toxicity”. The chain folds exposure, vulnerability and capacity into one term, vulnerability. Infectiousness can raise how many are infected, and toxicity the share of them who die.
The product is a long-run average of deaths from new pandemics. It does not give the deaths in any one calendar year, since a pandemic can run for several.
The UN definition also counts injury and damaged assets. They are measured in other units, so the chain counts deaths alone.
Marani’s record does not give expected pandemic deaths per year. It measures the intensity of each epidemic as its deaths divided by its duration and by the world population when it began. Only 182 of its 395 epidemics have a known death toll, and the record contains epidemics of all kinds, not only pandemics. From it, the authors estimate how often an epidemic of a given intensity or greater recurs. Based on the epidemics of 2000 to 2019, the corrected mean recurrence time for one at least as intense as the 1918 influenza pandemic is 879 years (95% interval 730 to 1,081).
Trust works upstream
Some vulnerabilities raise the number infected as well. In Bollyky’s study, “measures of trust in the government and interpersonal trust, as well as less government corruption, had larger, statistically significant associations with lower standardised infection rates”. At the same share of infected people who die, fewer infections mean fewer deaths per pandemic. The study does not test whether trust changes the chance of sustained human transmission.